
Measuring web performance
We are believers of the well-known phrase “performance is a feature”. Performance influences engagement, conversion rates, and should be considered inseparable from the general user experience. Speed is also a ranking factor in Google. On a professional level, we need to take performance optimization seriously while keeping the focus on delivering business value. Without standard metrics and tools, performance optimization can easily become an endless journey in which you can only stop but never reach your destination. Recently, we’ve done a thorough review of our standards, internal goals, and tools to measure web performance.
Our approach and internal standards
When we established internal performance standards on a company retreat back in 2019 our goal was to select tools for measuring performance that are:
- Widely adopted and accepted - to not have to argue over why they’re being used and so that we can compare our results with other sites.
- Transparent - open source tools are preferred.
- Easy-to-use - to avoid slowing down our development processes and so that non-developers can also verify the results.
- Recommended by Google - to measure what might influence the search rankings.
It was also important to select something that we can then present and explain to our clients quite easily.
We wanted to cover other areas as well. We first ended up using Lighthouse, an open-source tool backed by Google, incorporated into the Chrome dev tools, and also available online. We’ve been using the online version (https://web.dev/measure/) to mitigate the differences caused by the network and CPU of the client machine.
We decided to set minimum goals as internal KPIs to reach for our dev team at 50 for performance and 90 for the 3 other aspects Lighthouse is measuring (Accessibility, Best Practices, and SEO).
It is important to note that the performance score on Lighthouse is for mobile web performance.
The reason why we went down to 50 is the approach Lighthouse took for measuring mobile web performance: it simulates an old mobile device with limited CPU power and a low bandwidth internet connection; thus, for anything Javascript-heavy or complex it is very hard to reach 90 or more.
Core Web Vitals and PageSpeed Insights
Recently, we switched from Lighthouse to PageSpeed Insights as the primary tool for checking web performance. Advantages:
- Separate mobile and desktop metrics
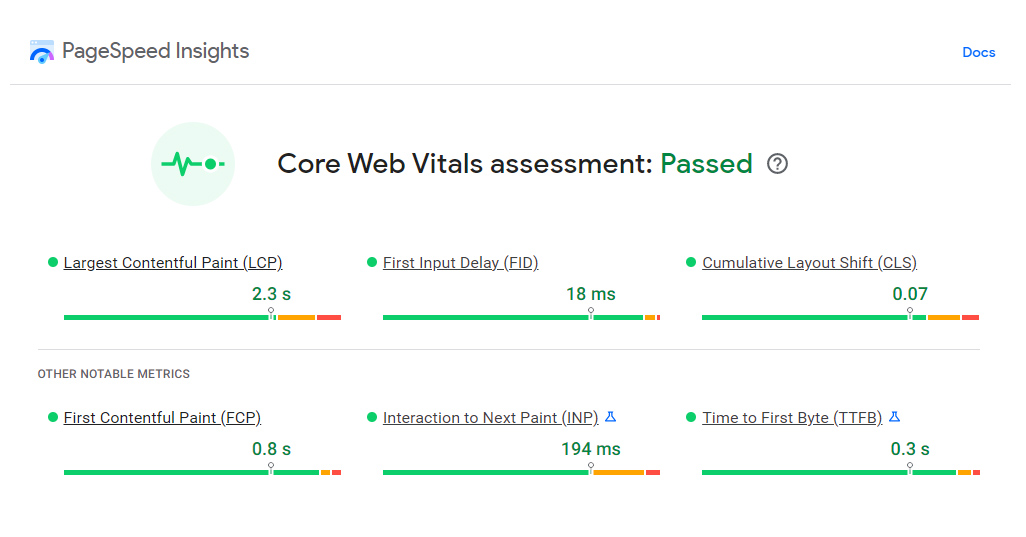
- Core Web Vitals shown when available, which are based on real-world data from the Chrome User Experience Report.
It is more important what the real users are experiencing than any lab metric and, this is why our primary goal has been set to pass the Core Web Vitals Assessment. Core Web Vitals are not always available and the public data has a refresh delay. As a fallback, we still use lab tests during development and deployment processes: our internal standard minimum scores are set to 50 for mobile, and 90 for desktop on PageSpeed Insights. This wasn’t a big change, as both Pagespeed insights and Lighthouse are using the same codebase and our records confirm that the Lighthouse performance score is very close to the Pagespeed insights mobile web performance score.
Of course, this is just our default internal target and we might set various different KPIs per project for example to simulate the devices and connection types of the real users or to take into account the specifics of some Javascript-heavy (for example decoupled) solutions where the first-page impression might be slower, but in return subsequent pages are rendered faster. For this reason, we'll show some complementary tools down below that we’ve tried out.
Alternative performance metrics tools
When to use a custom tool? Just a couple of examples when you might need another tool on top of checking Core Web Vitals and PageSpeed Insights.
- Device specific testing (gtmetrix, uptrend, webpagetest)
- Browser specific testing: Core Web Vitals in PSI are based on CrUX, which is Chrome based. If you gather your own Web Vitals data that can fully represent your audience. (gtmetrix - pro only, uptrend)
- Custom bandwidth (gtmetrix - predefined custom with pro, uptrend - predefined, webpagetest)
- Location (gtmetrix - more options with pro, uptrend, webpagetest)
- Disabling external Javascripts for the benchmark (gtmetrix, webpagetest)
- Adblock (gtmetrix)
- HTTP Authentication (gtmetrix, webpagetest)
- Repeated tests and logging + alerts (gtmetrix, uptrend, webpagetest)
- Testing a session (a user journey) (gtmetrix - using a session cookie, webpagetest - with custom script)
Google recommends a list of tools for performance measurement:
https://web.dev/speed-tools/#what-are-the-different-performance-tools
We also checked 3 more tools as they offer some special features:
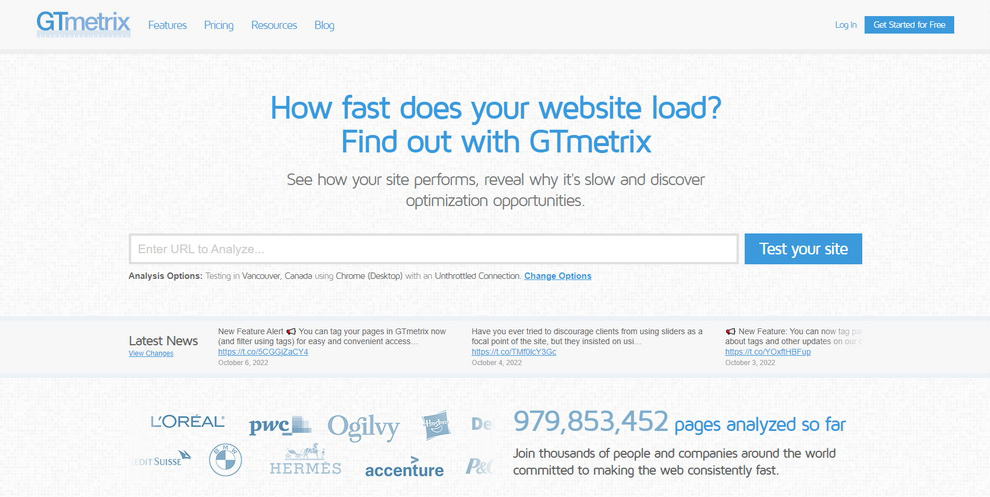
Gtmetrix
Uses a combination of Google PageSpeed Insights and YSlow to generate scores and recommendations.
GTmetrix Performance is the performance score from the Lighthouse site audit tool.
GTmetrix Structure is a proprietary performance metric that measures the overall performance of a page.
Pros
- API speed test
- Http auth
- Can test with adblock enabled
- Can test on different mobile devices
- Speed monitoring
- Can create a video
- Compare 2 sites
- Detailed report page
- Well-known tool
Cons
- Payment required to unlock the Pros
- Harder to understand the report page than PageSpeed
Full description: https://kinsta.com/blog/gtmetrix-speed-test/

Uptrends
Uses Pagespeed insights for site speed test.
Pros
- Can test on different mobile devices
- Can test from different locations
- Can test different desktop resolutions
- Can test different browsers
- Possibility to throttle connection
- Monitoring server/speed
- Slack and other integrations
- Api access
Cons
- Not that well known
- Paid
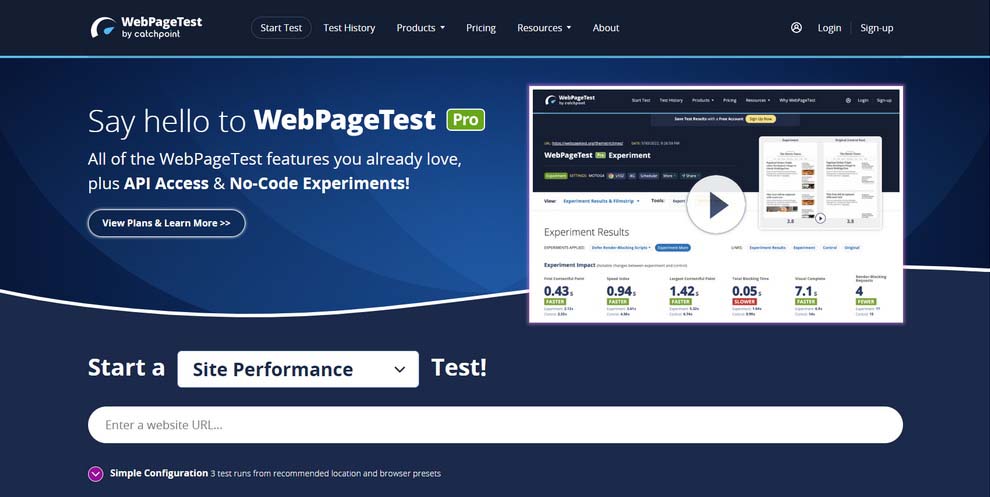
Webpagetest
Uses Google Chrome user experience report to generate real world data.
Pros
- Has a large number of parameters
- Can test on different mobile devices
- Can test from different locations
- Can test different browsers
- Runs test 3 times in a row
- Provides recording for each test
Cons
- Has a large number of parameters
- Not that well known
- Does not provide a general score for performance hence not easily comparable with other tools at a glance.
Selecting the right pages to measure
Pages to be measured should be selected and prioritized based on their importance. For example, on a news site, an article page should definitely be added to the sample for monitoring. For an e-commerce site product pages are more important to track than the home page. The pages should be selected based on the most important content and user journeys on each site.
Lab metrics or real-world data
We believe that the verification of the efforts invested into performance optimization should be measured in the real world. What might be even more important is that Google believes the same and Core Web Vitals affects the search ranking of webpages. This is why we like the Core Web Vitals report in PageSpeed Insights and treat it more important than the scores coming from lab metrics. We also like very much the Site Speed report in Google Analytics (UA) as it also shows trends on whether the site is getting faster or slower. We hope it will eventually come out on GA4 soon. For now, there is a way to add your own Core Web Vitals field data: https://web.dev/vitals-ga4/. This is useful for low traffic sites with no data in PageSpeed Insights Core Web Vitals.
These arguments might beg the question: why do we need lab metrics after all? The answer is that we need them for actual development. It is much more challenging to debug and actually do the optimization without easily and quickly reproducible lab measurements.
https://web.dev/speed-tools/#understanding-lab-vs-field-data
Load and scalability testing
While PageSpeed Insights is a great tool to measure a page’s performance when hit by a single request, we need more for high-traffic sites. We need to be sure pages will perform well under high load. Simulating high load can be done by using a simple good old command line tool: Apache Benchmark (ab).
Apache Benchmark can throw requests to specific URLs in parallel with a defined concurrency level.
We usually repeat ab runs while raising the concurrency to see how scalable a system is, monitoring primarily the requests/second metric.
We do this in isolated (lab) environments, usually on our staging sites.
It’s also possible to test your local site during development, for example, the following command throws 10k requests to your local with 100 concurrent requests in parallel:
ab -c 100 -n 10000 http://localhost/
Conclusion
While web performance is a broad topic there are numeruous tools to measure it and the industry has been mostly standardizing on the open source PageSpeed (Lighthouse) for lab metrics, in some cases extended with proprietary tooling. Google’s market weight is inevitable and Google page rankings are affected by page experience even though it does not carry as much weight as content relevance / traditional SEO. Luckily Google provides data and tools to assess real-world performance. By passing the Core Web Vitals assessment this can be confirmed easily. This affects mobile performance (since 2018) and desktop (since 2010) searches and is also included in the PageSpeed Insights when there is enough data available.
Taking into account the full stack and the infrastructure there are other dimensions of web performance testing such as load, and scalability testing and for those, there are also various tools available.
Once again our currently selected tools for measuring web performance
- Core Web Vitals showed in Pagespeed Insights and Google Search Console.
- When CWV is not available or when we need easily refreshable lab metrics we check the scores on PageSpeed Insights.
- Apache Benchmark is still our default tool when it comes to load and scalability testing.